CS5346 Report - Singapore Property Market Analysis
Singapore’s housing market remains a healthy and steady growth in the past years. Even though the struggling economy caused by the COVID-19 pandemic, there is still a 2.2% of residential property index rose. With limited land supply in a small island country, it is believed the price will continiously prop up in future. This project aims to bring some insights for the property buyers or potential property buyers by providing an overview of important characteristics of properties across different districts in form of geo map and a few further analysis like project development trends, distrcts transactions heatmap, and etc.
In this project, multiple public service APIs and data sources have been utilized and used to form the visualisation data. Tableau is used as the tool to provide various forms of visualisation for different analytical queries.
Proposed Queries
In total we have 6 visualisations (in this post only the first two is listed) to anwser the following queries:
- Visualisation 1:
- Which districts/areas in Singapore:
- have the highest transaction price per square meter?
- have the highest density of freehold/999 tenure type of private properties?
- have the most numbers of hawker centers?
- What are the proper tenure types should be considered to be more value preserving?
- what are the overall distribution of HDB and private properties across the whole island?
- What are the availabilities of the properties with a specific numbers of bedrooms (or estimated flat sizes)?
- Which districts/areas in Singapore:
- Visualisation 2:
- What are the transaction frequences of properties in different districts in Singapore across the past years?
Data Sources
In this project, multiple data sources and public service APIs are leveraged:
-
Data Source: HDB Resale Flat Prices from data.gov.sg which contains the resale hdb flat pricing information in Singapore from 2015 to 2021. Each resale transaction contains the time, price, flat type, blk number, hdb town, flat size and remaining tenures of the corresponding unit.
-
Data API: Private Residential Property Transactions from ura.gov.sg which provides the public api for query private property transactions for a given distct code. The transaction record includes the name of the property, flat size, price, date of transaction, property type and tenure.
-
Data Source: URA Carpark Information from data.gov.sg which contains the geographical information of carparks allocated in different locations of Singapore
-
Data Source: Hawker Centers from data.gov.sg which contains the geographical information of hawker centers allocated in different locations of Singapore
-
Data API: Postal Code Query from developers.onemap.sg which provides public api to resolve the postal code, given the property name of a condo or the block number plus the hdb town of a hdb resale flat.
Visualisations
1 GEO Graphical Distributions of Resale HDBs and Private Properties in Singapore
Rationale: There are over 10,000 HDB blocks and 220,000 apartment units distributed across over 25 districts in Singapore. In order to understand the overall property market in Singapore, it is both intuitive and essential to visualize the transaction data from a geographical visualization perspective.
Data Preprocessing: Since the visualisation involves mergeing the transaction records from different data sources and APIs, the following efforts have been made to create the eventual visualisation data:
- For both the HDB resale transaction records and the private property transaction records, the postal code is retrieved based on the private property name or the hdb block number plus the hdb town name.
- The HDB and private property transaction record is merged into a single table. Parts of the fields in two tables are directly mapped to the same field in the merged table, parts of the fields like tenure, remaining tenure, price per squaremeter, and etc are calculated from the original fields in each table.
- For the same type of unit (number of bedrooms) for each private property or each hdb blocks, the transaction prices across different years are grouped and further the pricing trend for short term and long term is calculated. Each of the grouped transactions for the same type of unit in a specific hdb block or private property is reduced to a single record, which records the transaction pricing trends and most recent year’s price per square meter.
- For each of the hdb block and private property, the postal code is further transformed to longitude and latitude as well as cartesian coordinates which can be further used to calculate the distance between geographical points.
- Based on the cartesian coordinates of each hdb blocks and private properties, the distance between the unit and all the carparks and hawker centers are calculated. In such a approach, the number of nearby carparks and hawker centers for each of the hdb and priavte property units are deduced.
The eventual data table generated after the preprocessing procedure is described below:
| Field | Description | Example |
|---|---|---|
| Property Name | name of the property | ANG MO KIO AVE 10 541 |
| Tenure | tenture of the property | 99, 999, Freehold |
| Postal Code | postal code | 560541 |
| Completion Year | year of completion | 1981 |
| No of Bed | number of bedroom | 2 |
| Remaining Tenure | remaining tenure | 59 |
| District Name | district | “Bishan, Ang Mo Kio” |
| Type | property type | HDB |
| Lat | latitude | 1.37392239168826 |
| Long | longitutde | 103.855621371068 |
| X | x in cartesian | 39546.88471445934 |
| Y | y in cartesian | 30482.02654878373 |
| Price Trend S | short term price change (%) | -0.9 |
| Price Trend L | long term price change (%) | -5.1 |
| Price Per Square Meter | price per sqm | 4111.6 |
| Carparks < 1 KM | no of carparks in 1 km | 0 - 2, 3- 5, 6 - 10 |
| Carparks < 3 KM | no of carparks in 3 km | 0 - 2, 3- 5, 6 - 10 |
| Hawkers < 1 KM | no of hawkers in 1 km | 0 - 2, 3- 5, 6 - 10 |
| Hawkers < 3 KM | no of hawkers in 3 km | 0 - 2, 3- 5, 6 - 10 |
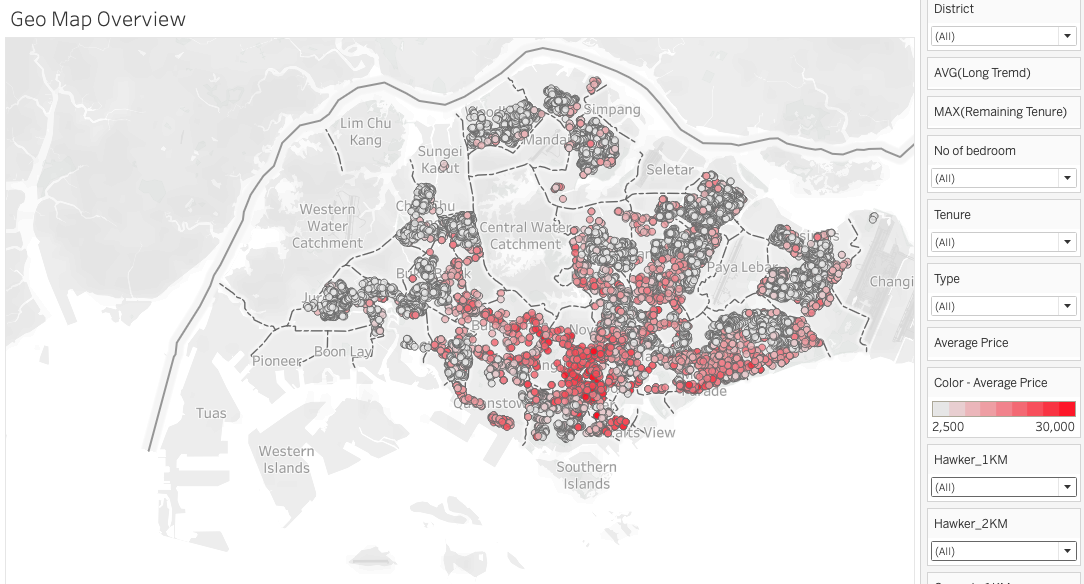
Visual Encoding: The map in the background is the singapore territory. Different districts are seperated by the doted black border lines. Each dots in the geo-map represents a property. The color of the dot depicts the average rencent transaction pricing of the property per square meter, ranges from the plain gray (2,500 sgd/sqm) for HDB flats to the red (30,000 sgd/sqm) for luxury private units. There are numbers of filters to which can help users to further dive down and filter out portions of the properties in the map based on their preferences. There are several examples:
- District: users can select one to many districts in Singapore, only the properties in the selected districts will be filtered out.
- Short/Long Pricing Trend: users can select the range of pricing change to identify properties with strong investment potential and those not.
- No of bedrooms: users can filter available units via number of bedrooms to focus on those unit with the suitable sizes.
- Price per squaremeter: users can filter available units via price per squaremeter to focus on those within his/her budget.
Beside of the filter, when each dot is selected, additional information of the property is displayed in the tooltip of the selection, which includes the types of tenure, the prices per sqm, remaining tentures and estimated year of construction.
Charting Logic: To build this visualisation, the map is firstly built based on the longitutde and latitude information of the properties. The most recent 3 transaction prices for the property is retrieved to calculated the transaction price per sqm. The color of the dots are then visualized. Based on the overall geograpgical plot of the properties, extra informations like tenures, remaining tenures, transaction price trends and availability of public facilities are further aggregated into the visualisation inform of filter.
Queries: From this visualisation, by properly tunning the filters, the following queries have been answered:
Query 1.1
Query: Which districts/areas in Singapore have the highest transaction price per square meter?
Visualisation: Filter out all the properties with price psm above 15,000 sgd in Singapore.

Insights: Central areas like Bukit Timah, Tanglin, Orchard, Bukit Timah, Novena and parts of east like Gelang and Marine Parade have the largest numbers of property with price psm above 15,000 sgd.
Query 1.2
query: Which districts/areas in Singapore have the highest density of freehold/999 tenure type of private properties?
visualisation: Filter out all the property with tenure of Freehold and 999 years.

Insights: Central areas like Bukit Timah, Tanglin, Orchard, Bukit Timah, Novena and parts of east like Gelang and Marine Parade have the largest numbers of Freehold and 999 years tenure properties. There are also small amount of Freehold / 999 year properties allocated in Northen and Western districts as well.
Query 1.3
Query: Which districts/areas in Singapore have the most numbers of hawker centers?
Visualisation: Filter out all the properties with number of hawkers available with 1 KM more than 3

Insights: It seems those distcts close to the Downtown core areas has the highest density of hawker centers. Properties in the areas with the highest of price per squaremeter and rural HDB towns like Yishun, Jurong most likely tend to have 0-2 hawker center nearby.
Query 1.4
Query: What are the proper tenure types should be considered to be more value preserving?
Visualisation: Filter out the properties with increasing and decreasing pricing long term trends and make the comparison between the propotion of 99 leasehold and freehold.
- properties with pricing increased in the past 3 years, 2861 in total, out of 600 are 999-leashold and freehold tenure.

- properties with pricing decreased in the past 3 years, 3753 in total, out of 480 are 999-leasehuld and freehold tenure.

Insights: In terms of value preserving, 999 and freehold property seems to have a higher chance in a increase in transaction price.
Query 1.5
Query: what are the overall distribution of HDB and private properties across the whole island?
Visualisation: Select the property type on HDB and Condo seperately, observe the geographical distribution and overall price range in terms of color of the dots.
- HDB resale flats:

- Private properties:

Insights: hdb units are mostly transacted at price per sqm belong 10,000 and private properties price per sqm are usually above 10,000. Private properties are more concentrated in central areas like Tangling, Bukit Timah and parts of east coast. Hdbs are scattered around the whole island, but with a lower density in the central area.
Query 1.6
Query: What are the availabilities of the properties with a specific numbers of bedrooms (or estimated flat sizes)?
Visualiation: in the filter for number of bedrooms, we select a specific number of bedroom value each time and observe the allocation of properties in the geomap.

Insights: Most of the properties with 1 bedroom and 5 bedrooms and more are private properties. Most of the hdb flats have 2 bedrooms and 3 bedrooms.
#2 Transaction Frequency Heatmap of Condos and HDBs in Different Districts

Rationale: In the first visualization, we had an overall picture of the characteristics of properties across different districts like average prices per square meter. Another important factor for a property buyer needs to consider is the frequency of transactions in a district. If the properties in a district are relatively demonstrating high transaction frequencies, it also means the buyer has more options to choose currently and sell the property to the next buyer in the future.
Data Preprocessing: Based on the raw transaction data of HDB and condo, the transaction records are merged following the similar manner mentioned in visualisation 1. Instead of reducing the transaction records to calculate the average transaction price and price trends for the specific type of property unit, the transaction records for each property is reduced to calulate the accumulated number of transactions per property accross different months between 2017 to 2021. The eventual data table after preprocessing the data is demonstrated below:
| Field | Description | Example |
|---|---|---|
| Property Name | name of the property | ANG MO KIO AVE 10 541 |
| District | name of district | “Bishan, Ang Mo Kio” |
| Type | type of property | HDB |
| No of Bed | number of bedroom | 2 |
| Number of transaction | number of transaction | 214 |
| Time | year and month | 07/2019 |
Visual Encoding: In the heatmap, the rows at a fixed Y axis position identifies each district. The X axis depicts the months ranged from 2017 to 2020. Each cube in the map records the number of transactions of a given district at within a given calendar month. The color indicates the numerical values of the transaction amount from white (0 transactions) to pink (as much as 1,100 transactions). Addtional informations are also displayed in the tooltip when each of the element is highlighted, including distrct name, quater, year, month and transaction count.
Charting Logic: To build this visualisation, the time and distrct are setup as columns and rows in form of discrete data types. The sum of transactions for all the properties are further encoded in terms of colors for the grids. Extra filters are applied to let users to browse the heatmap of condo transactions and hdb transactions both seperately and as a whole.
Queries: From this visualisation, by properly tunning the filters, the following queries have been answered:
Query 2.1
Query: What are the transaction frequences of properties in different districts in Singapore across the past years?
Visualisation: Observe the transaction heatmap for hdb resale, condo seperately and as a whole.
Insights: For a given district, there are no obvious change in transaction in through years. Serangon, Hougan and Punggol has the most active property transaction records in the past years. One of the key factor is due to the area is new and most of the properties are recently developed. There is a sharp drop of transaction records across all the districts in 2020.April and May, which is caused by the Covid-19 outbreak in Singapore during that time.